We include a simple read/write API, that lets you poll our database for the current status of your hosts, as well as manage hosts and contacts on your account.
The API can easily be integrated into existing monitoring systems, like Nagios or Zabbix, by performing a simple HTTP GET request for the list of currently listed hosts. The response data can be returned either as simple XML, or as a JSON object.
$ curl -G https://api.rbltracker.com/3.0/listings.json \
    -u 'your_account_sid:your_auth_token'

{
    "status_code": 200,
    "status_message": "Ok",
    "total_listed": 1,
    "data": [
        {
            "id": "5afd618836c251cbb066803f25b87fa1",
            "host": "127.0.0.1",
            "name": "Primary Mail Server",
            "status": "active",
            "last_checked": "2012-12-30 21:00:07 EST",
            "first_listed": "2012-12-17 11:05:03 EST",
            "listed_period": "13 days 13:35:58",
            "listed": "1",
            "listed_count": "2",
            "listed_details": [
                {
                    "host": "b.barracudacentral.org",
                    "website": "http://www.barracudacentral.org/rbl/",
                    "details": "http://www.barracuda.../?pr=1&ip=127.0.0.1"
                },
                {
                    "host": "sbl.spamhaus.org",
                    "website": "http://www.spamhaus.org/sbl/",
                    "details": "http://www.spamhaus.org/sbl/query/SBL21"
                }
            ]
        }
    ]
}
We also provides simple, downloadable plugins for both Nagios and Zabbix, that can get you up and running within a few minutes.
- Nagios Plugin – https://github.com/rbltracker/nagios
- Zabbix Plugin – https://github.com/rbltracker/zabbix
We can also be integrated into your existing provisioning systems, to automatically add/remove monitoring of hosts, as resources are allocated on your system. This ensures that only those hosts that are in-use are monitored.
$ curl https://api.rbltracker.com/3.0/host/add.json \
    -u 'your_account_sid:your_auth_token' \
    -d name='Test' \
    -d host='10.10.10.10' \
    -d type='rbl' \
    -d rbl_profile='RP15d4e891d784977cacbfcbb00c48f133' \
    -d contact_group='CG37106c6baa1ec90a2b3f5c8ec54afe9d'

{
    "status_code": 200,
    "status_message": "Hosts added successfully.",
    "data": [
        {
            "id": "37c46a725dd8adab28d35b9f200c198d",
            "host": "10.10.10.10",
            "name": "Test"
        }
    ],
    "version": "2.0"
}
Getting Started
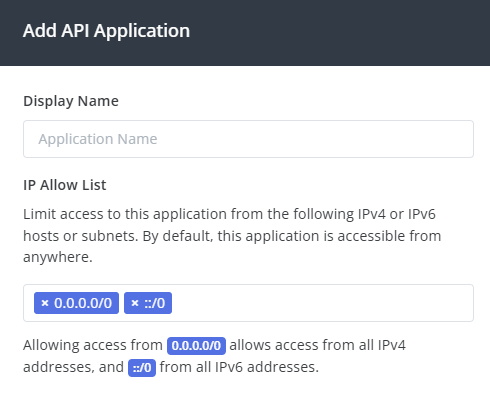
To get started with the API, visit the Dev -> Applications section of the portal. From this section, you can create one or more API Applications, each of which has their own Auth Token for authenticating API requests.
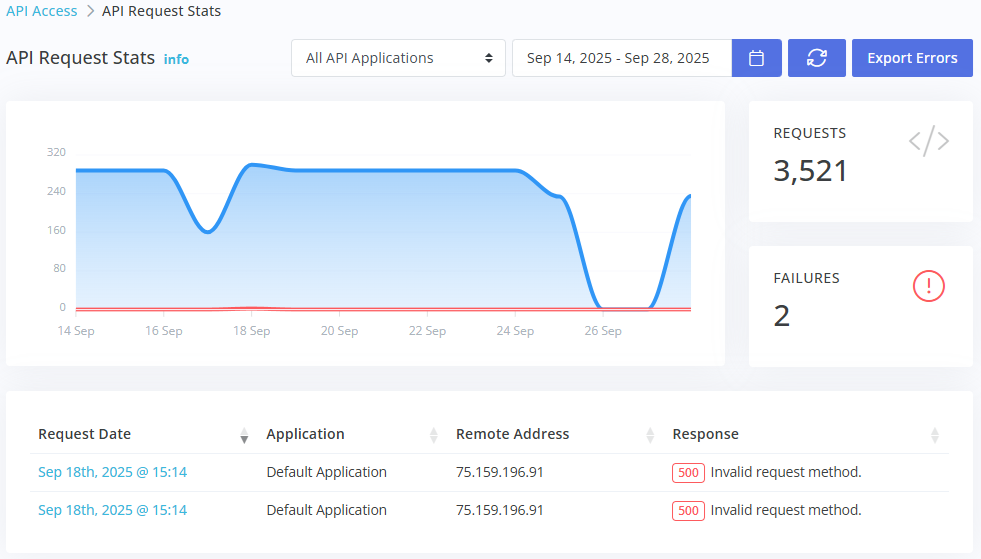
Each API Application also includes request and errors stats, including a graph breakdown of requests, and a error log with detailed details about the error conditions:
Customers can add as many API Applications as they like, each of which can be separately managed and reported on.